In statistics, hypothesis tests enable you to gauge whether the results of a study, experiment, or survey have produced meaningful results.
T-tests are of different types and can be used under different circumstances. If you need to compare a mean to a hypothesized value, you can use a simple one-sample T-test.
On the other hand, if you have two groups and need to compare the means of two independent samples, you can use a two-sample t-test. If the groups happen to have paired observations, you could use a paired t-test.
But how does one carry out t-tests? More importantly, how does one interpret its results?
To answer those questions, we break down t-values, t-distributions, and their role in t-tests in this post.
How to Interpret T-Test Results?
Before you can interpret the result of a t-test, you need to understand what t-tests are and how to perform them.
What Is a T-Test?
A t-test enables you to contrast the average values of two data sets, post which you can determine if the sets came from the same population.
However, performing the tests is a lot more nuanced.
How T-Tests Work
When you perform a t-test, you essentially take a sample from two sets and establish a null hypothesis that assumes the means of the sets are equal.
You then move on and apply some formulae to determine certain values. These values are then compared with standard values, and if the values meet specific criteria, the null hypothesis is accepted. If the set criteria is not met, the hypothesis is rejected.
In most cases, when a null hypothesis is rejected, it means that the data readings are strong. In other words, if the null hypothesis doesn’t meet the specifications and has to be rejected, it is likely not due to any errors you’ve made.
T-tests are one of the many tests made for testing whether a null hypothesis is true or false. Some other tests that help reach the same goal include the f-test and the chi-square test.
If a statistician is dealing with large sample sizes, then they will likely use a z-test.
Types of Tests
As mentioned earlier, there are different types of t-tests. While the tests can be categorized into one-sample and two-sample tests, they can also be categorized as dependent and independent tests.
There is only one dependent t-test, known as the paired t-test. However, there are two independent t-tests: the equal variance and the unequal variance t-tests.
We discuss how to perform each of these tests in the next section. But before you learn how to do them, it is imperative that you learn under what circumstances you should be using which test.
The easiest way to determine which t-test is suitable for any scenario is by using the flowchart below.
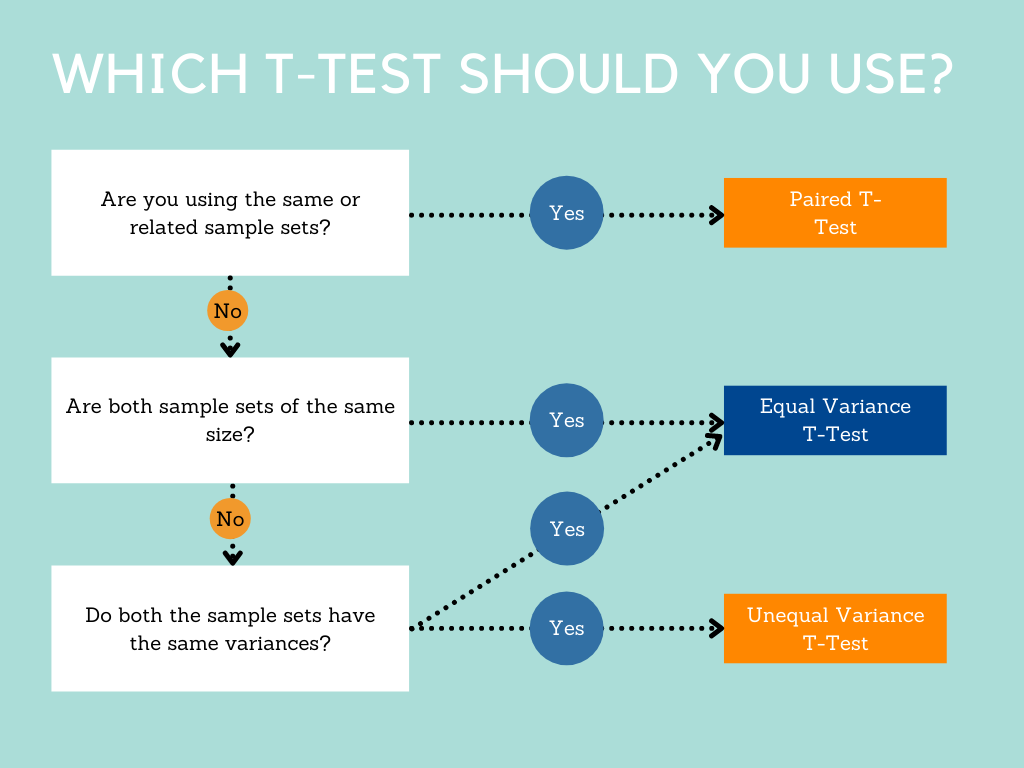
The key considerations you need to make when picking which test to use include working out whether the sample records are similar, the size of the sample sets, and the variances of the sample sets.
Performing T-Tests
As you learned in the last section, hypothesis tests use calculated test statistics to compare the null hypothesis to the sample.
If the test statistic turns out to be extreme enough, it indicates that the data doesn’t work in favor of the null hypothesis, and the hypothesis must be rejected.
The calculated test statistic that facilitates this process is the t-value. The value is one of the results of a t-test. (musicmundial)
To calculate t-value, you must find three values:
- The mean difference;
- The standard deviation; and
- The size of each group.
Here you can also find a step by step guide for performing a T-test on your calculator
T-values are a unitless statistic, which makes it challenging to interpret on by itself.
Let’s say you perform a t-test, and the t-value it produces is 2. What does this mean?
We know for sure that since the t-value isn’t zero, the sample mean isn’t equivalent to the null hypothesis.
But we do not understand how rare the value is if the null hypothesis turns out to be correct by simply looking at the t-value.
For this reason, the t-value is compared with a value in a table called the T-distribution table. Comparing the values enables us to work out the effect of chance on the mean difference and also helps determine whether the mean difference is outside the chance range.
In this way, a t-test also answers the question of whether the difference between the groups is an actual difference or only a random difference.
Before we dive deeper into understanding what T-distributions are, here’s a quick look at the formula for the three different types of t-tests.
The Formula for the Paired T-Test
This test is carried out when the samples comprise matched pairs of related units.
For example, the test may be performed when the samples are related somehow, like comparative analysis of siblings or parents.
The test is also performed when there recurring records in the data. An excellent real-life example of this scenario is when patients in hospitals are tested several times – before and after every treatment they receive.
In these cases, the patient’s data is used as a control sample against itself.
As you can tell, the data sets involved have two sets of related samples, which is why the Paired t-test is a dependent t-test.
To calculate the t-value using a paired t-test, use the following formula:
t=mean1-mean2s(diff)n
Wherein,
- mean1 and mean2 represent the average values of the sample sets;
- s(diff) means the standard deviation of the differences of paired values;
- n represents the sample size; and
- n-1 represents the degrees of freedom.
The Formula for the Equal Variance T-Test
This test is used in scenarios where the sample size of the data sets are same, or the variance of the data sets are similar.
To calculate the t-value for an equal variance test, you can use the following formula:
t=mean1-mean2n1-1)×var12+(n2-1)×var22n1+n2-21n1+1n2
Wherein,
- mean1 and mean2 represent the average values of the sample sets;
- var1 and var2 are the variances of the sample sets; and
- n1 and n2 represent the sizes of the data set.
The formula to calculate the degrees of freedom in Equal Variance T-Tests is n1+n2-2.
The Formula for the Unequal Variance T-Test
This test is used when there is a difference in both the sample size and the variance of the two groups.
To calculate the t-value, you must apply the following formula:
t=mean1-mean2var12n1+var22n2
Wherein,
- mean1 and mean2 represent the average values of the sample sets;
- var1 and var2 are the variances of the sample sets; and
- n1 and n2 represent the sizes of the data set.
The formula to calculate the degrees of freedom in Unequal Variance T-Tests is:
Degrees of Freedom= (var12n1+ var22n2)2(var12n1)2n1-1+(var22n2)2n2-1
Where var1, var2, n1, and n2 represent the same values as before.
What Are T-Distributions?
When you look at a T-distribution, you will notice that it looks nearly identical to a normal distribution – but marginally shorter and fatter. These distributions substitute normal distributions when tests groups with small sample sizes.
T-distribution tables come in two formats, which appear depending on the data being tested. One-tailed tests are used to test cases that have a fixed value and a clear direction.
On the other hand, two-tailed tests are used to perform range-bound analyses.
T-distributions can be created with the aid of statistical functions in software like MS Excel.
The data in the T-Distribution table can be represented in a graph to understand the data more intuitively.
Here’s what a basic T-Distribution table looks like:
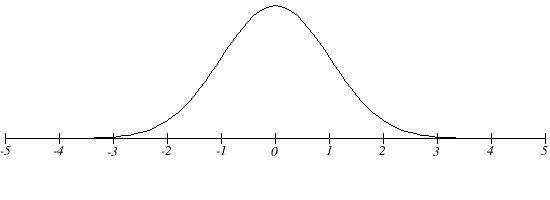
One peculiarity you will begin to notice as you work with T-distributions is that the larger the size of the sample, the more the t-distribution will look like a normal distribution.
If the number of data entries exceeds 20, the distribution will look almost precisely like a normal distribution for the same data.
The Results Of The Test
T-values are produced as a result of t-tests. These values can be mathematically defined as the ratio of the difference between the means to the variation of two sample groups.
The numerator, comprising the difference of the means, is easy to compute. However, calculating the variation in the sample set can get complicated depending on the values involved.
If the values are large, it indicates that the groups tested are incredibly different. In contrast, a smaller t-score suggests that the groups are similar.
However, t-values aren’t the only values that a t-test results in. As you may have noticed from the formulae mentioned above sections, another value is produced as a result of the test, which is the “degree of freedom.”
Degrees of freedom is the number of values in the study that vary freely – in every test of the data. While seemingly random, the values are of critical importance when evaluating the validity of H0.
Result Interpretation
Interpreting the results isn’t very complicated. All you have to do is compare the p-value to an alpha significance level.
If the value turns out to be smaller than the alpha level, then you can safely reject the hypothesis. In this scenario, since the alternative hypothesis will be true, the data will be significant.
Alternatively, if the p-value is larger than the alpha level, you can accept the null hypothesis that there is no difference between the given and sample data.
We have various comprehensive calculators that you can use online for free. You can choose from t-test calculator, graphing, matrix, the standard deviation to statistics, and scientific calculators. Check it here.