Best Graphing Calculator Online
Let AI help you with your problem
What is a graphing calculator?
Graphing calculator is a kind of calculator that is able to display plotted graphs for complex equations such as parabolas and other plotted results. It can perform more complex types of calculations than basic calculators and can process simultaneous equations.
Our online graphing calculator allows you to graph any equation, find its intersections, and create a table of values. With features such as polar equations, domain/range control, and the ability to store equations, matrices, and stats lists, Meta-calculator's graphing calculator is the best you can find on the internet.
Our online tool performs the same work with handheld graphing calculators. May it be to solve your algebraic equations, geometry, trigonometry, engineering problems, computer programming, statistics, or finance, our online graphing calculator is readily available to use for free.
How to use our online graphing calculator?
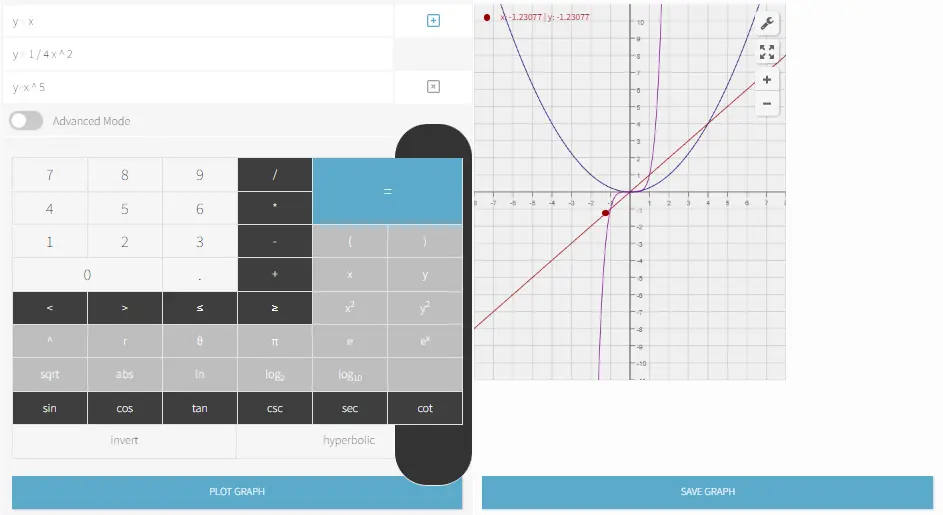
Enter the equation of the line you would like to graph, then click the Plot Graph button to make the result appear in the coordinate plane.
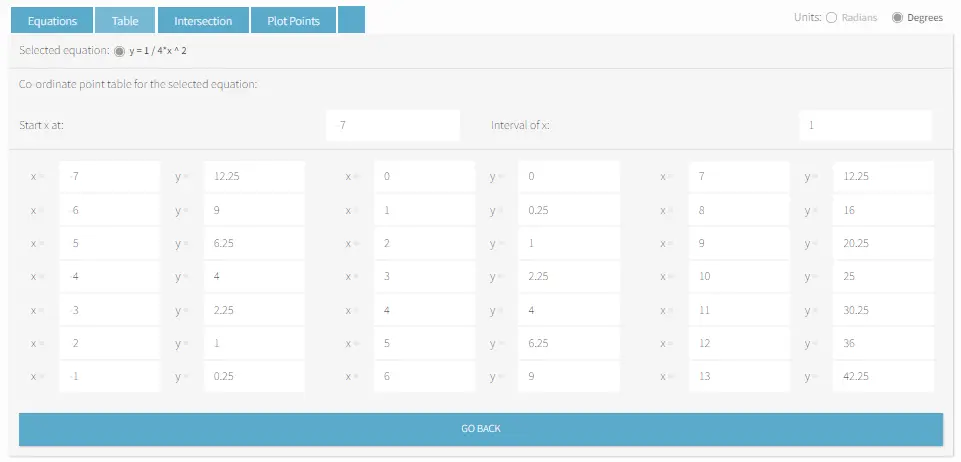
If you like to create a table of coordinates for varying values of x, go to the Table tab and select one item from your equations, then click “Create table”.
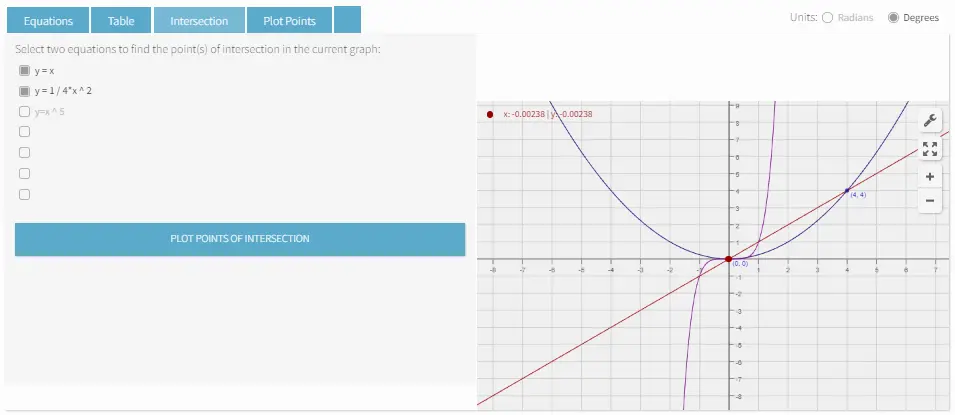
If you wish to find the point(s) of intersection, go to the Intersection tab and select two equations, then click the "Plot points of intersection" button.
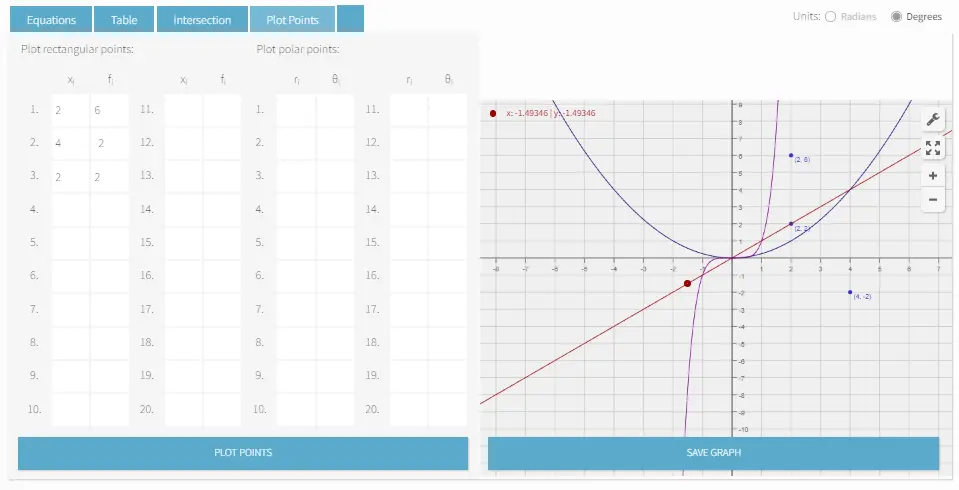
Under the Plot Points tab, you can plot rectangular points and polar points by entering the values in the table.
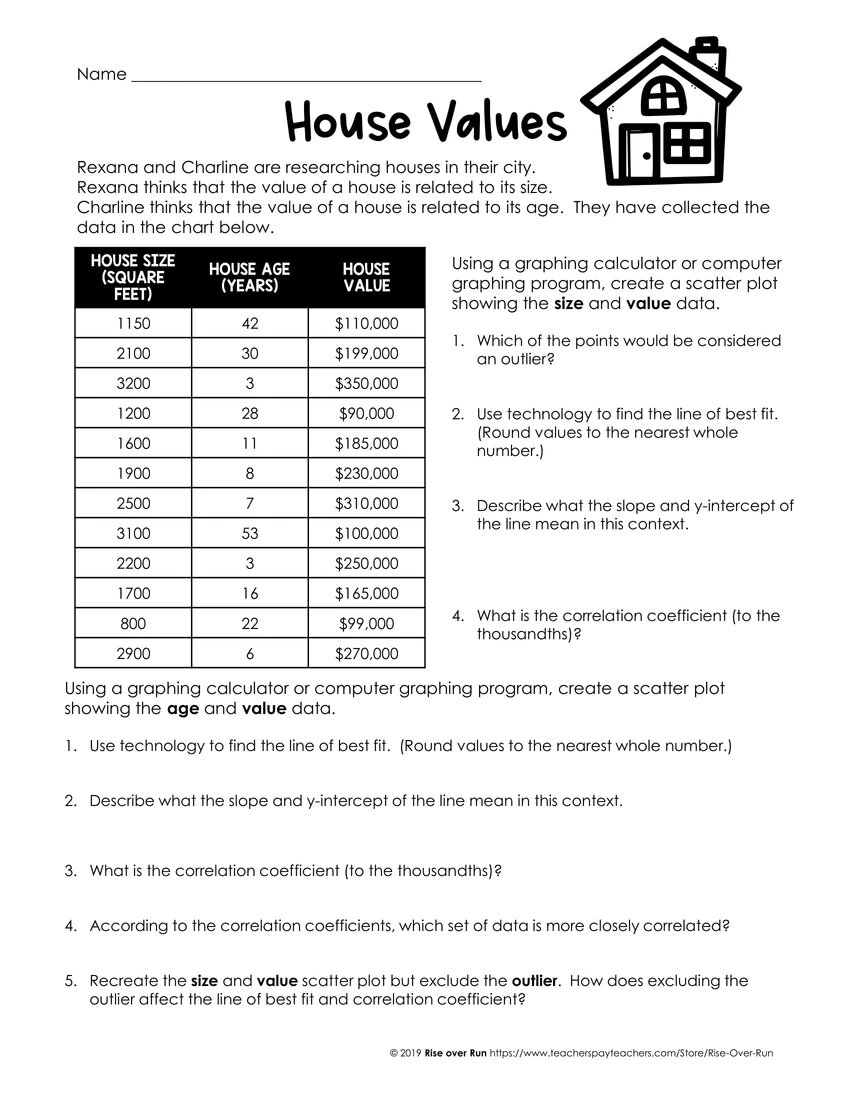
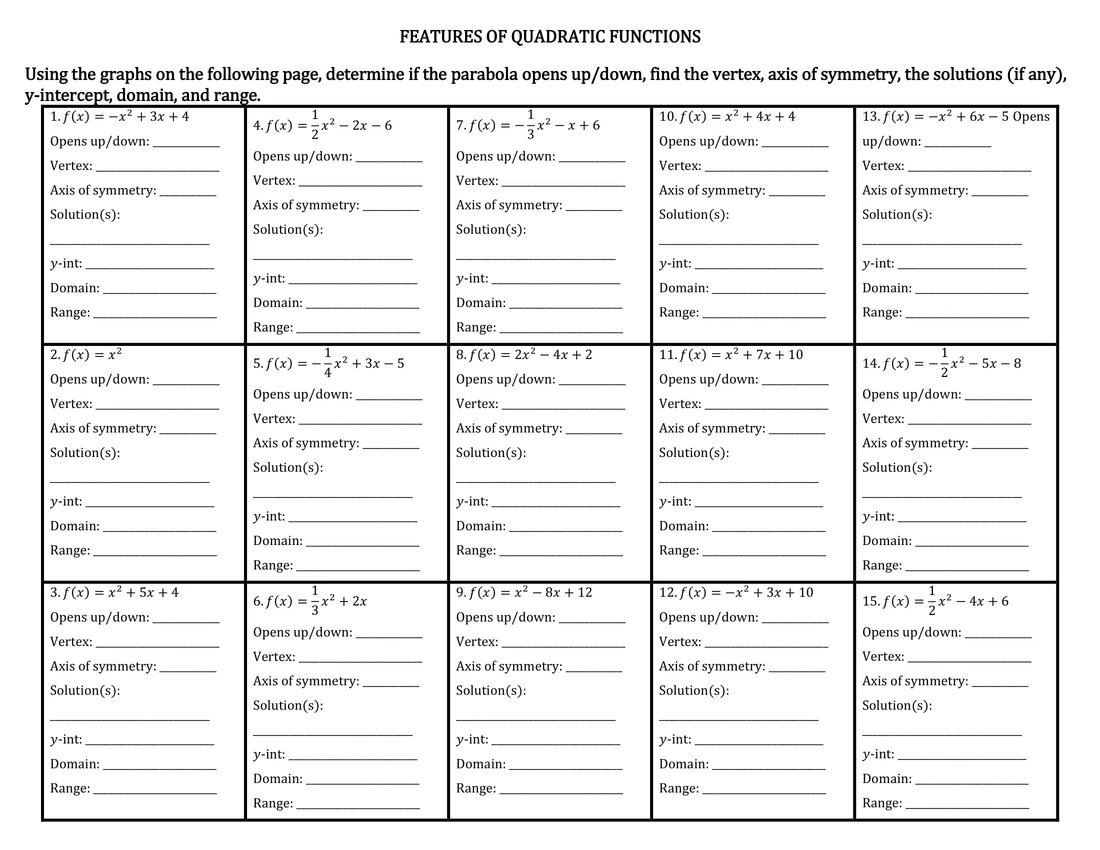
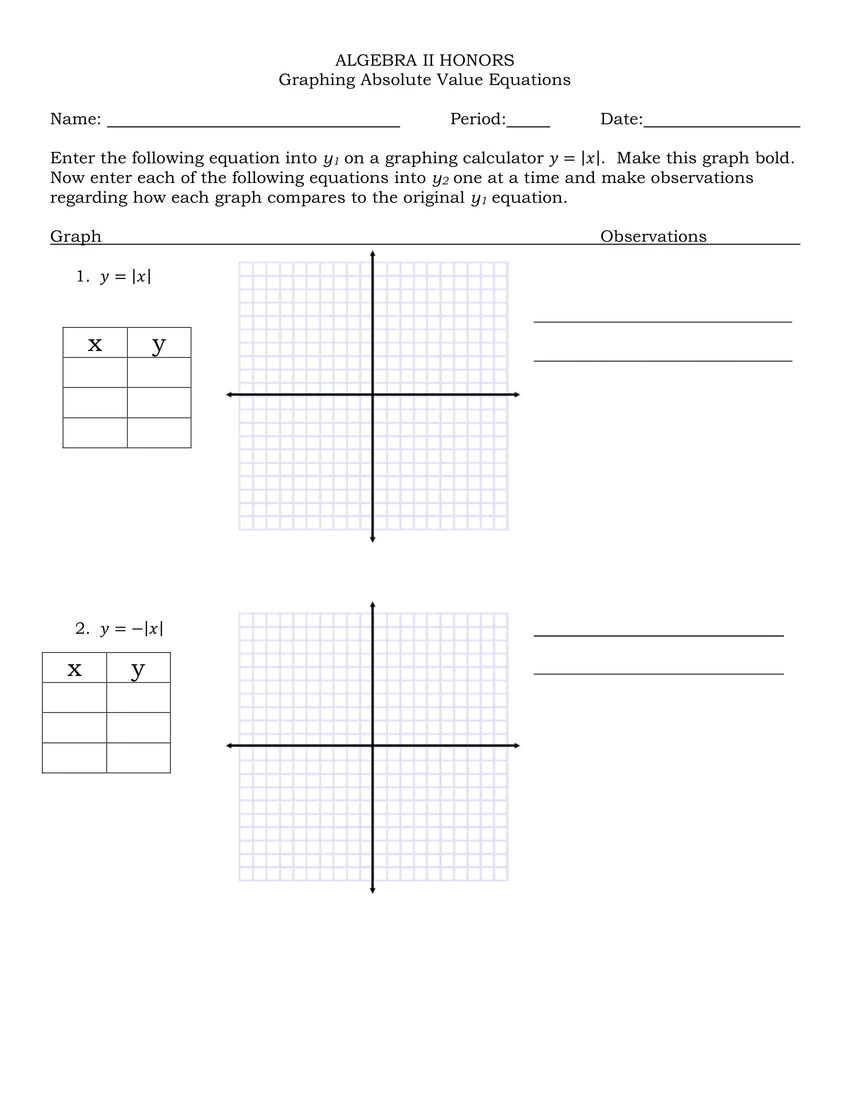
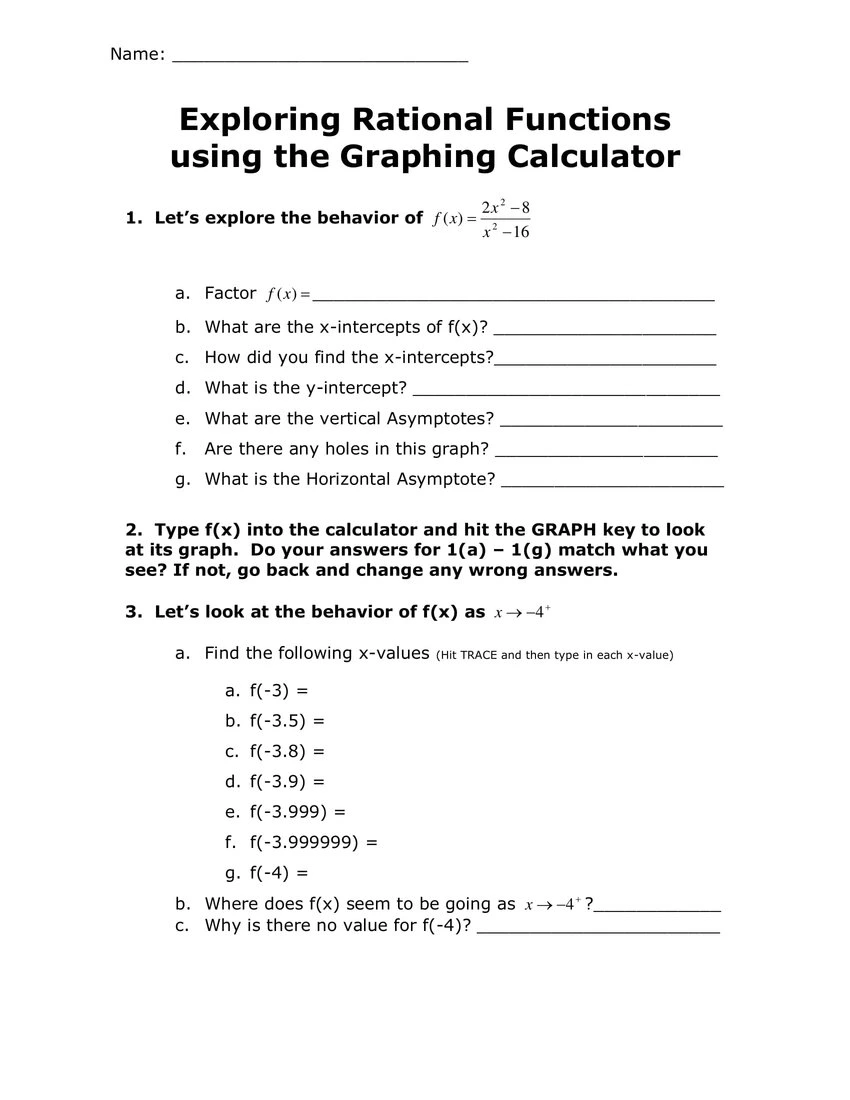
Graphing calculator handouts & worksheets
Here are a few resources where you can get free handouts and worksheets to test your graphing skills. Click the link to the desired worksheet to open the PDF file. All files are downloadable for free!