
T-tests are some of the most commonly applied statistical tests in all of math. If you pick up any research paper, chances are, you will see p-values in it.
Learning to do T-tests by hand and finding the p-value (with the help of a T-distribution table) will help you understand how hypothesis testing works much more deeply.
But before we get into it, here’s a quick refresher on what T-tests and p-values are:
A T-test is used in hypothesis testing to find whether the population mean is equal to a particular value. T-tests are of two kinds: one-sample t-tests and two-sample t-tests.
The p-value is the probability of obtaining observed or more extreme results when the null hypothesis is true. The ultimate goal of finding the p-value in a T-test is to understand when we should and shouldn’t be rejecting a hypothesis.
Now that we’ve gone over the basics let’s go over how to calculate the p-value from a t-test manually.
How To Calculate P-Value From T-Test By Hand
Step #1: Understand the Data
The easiest way to learn how to calculate the p-value manually is to read through the solution of an illustrated example.
Let’s say Ethan wants to determine whether the mean height of a specific species of a plant is equal to 15 inches.
To do this, he collects a collect a random sample of 20 plants of that species. He then calculates the sample mean from the height data and finds that it is 14 inches.
He also calculates the sample standard deviation from the height data and finds that it is 3 inches.
Now, to determine if the true mean height of the population of plants is 15 inches, you must conduct a T-test. Assume that the alpha level is 0.05.
Step #2: Frame the Hypothesis
You must first frame the hypothesis before heading on to calculating the values of the other parameters.
Let’s set our null hypothesis to indicate that the mean height is 15 inches. Consequently, our alternative hypothesis will assume that the mean height of the plant is not equal to 15 inches.
In other words:
Ho: µ = 15
Ha: µ ≠ 15
Step #3: Find the t Value
Before you can find the p-value, you must find the test statistic or the t value. Finding this value is easy since all you have to do is plug in some of the data into the test statistic formula, which is:
t=x– µ s / n
Where x̅ represents the sample mean and μ represents the hypothesized mean. The s in the equation is the sample standard deviation, and n represents the sample size.
In our example, the value of x̅ is 14, s is equal to 3, and the value of n is 20. We know that μ is equal to 15 from our hypothesis.
Plugging in those values:
t=14 – 153 / 20= -1.49
Therefore, the value of the test statistic is -1.49.
The next step students usually do is they feed these values into either an online calculator or statistical software and find the p-value.
If they find that the p-value is less than some alpha level (with students typically choosing 0.01, 0.05, and 0.10 as their test parameters), they then conclude that the null hypothesis is false and that the mean height of the species of plant isn’t equal to 15 inches.
However, that’s not what we’re going to do. Here’s how you use a t-distribution table to estimate the p-value by hand.
Step #4: Use the T-Distribution Table
To determine the p-value, you must refer to the t-distribution table. However, you must look at the values in the row with n-1 degree of freedom.
Since the sample size in this example is 20, you must at the values in the row representing 19 degrees of freedom.
Next, you must calculate the absolute value of the test statistic, which is 1.49. You must then look for this value in the table.
You will notice that while 1.49 isn’t in the table, it does lie between the first two values in the row representing 19 degrees of freedom – 1.328 and 1.729.
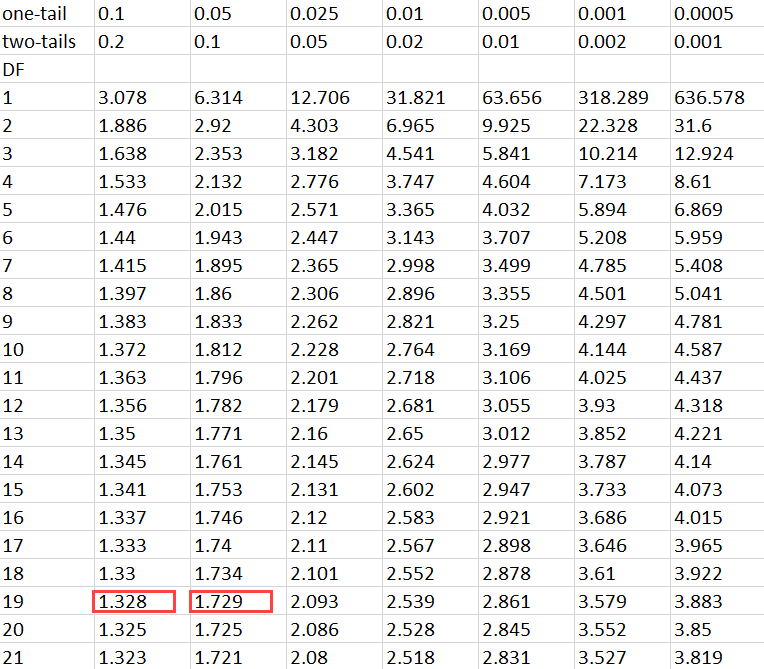
With this information handy, you must now look at the alpha levels that correspond with these values. These are 0.1 and 0.05, respectively.
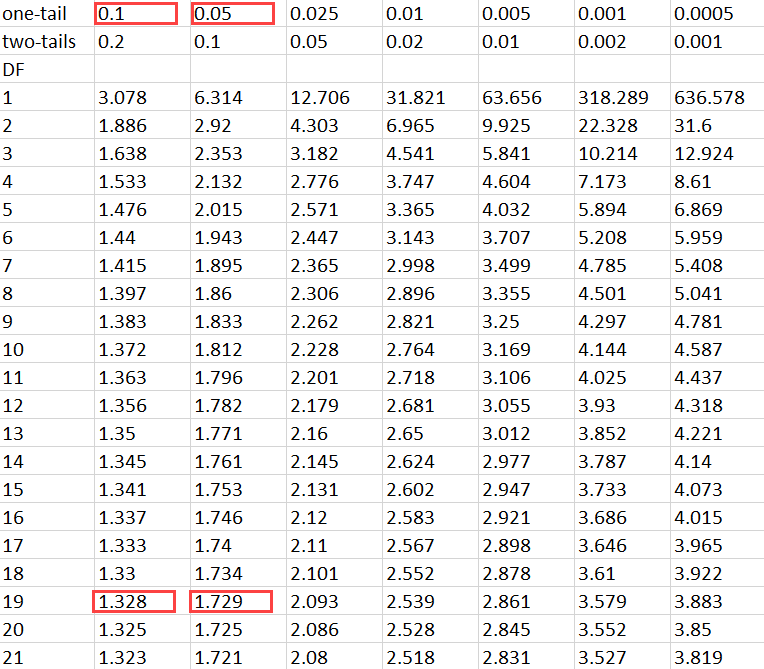
Therefore, the p-value for a one-sided test would lie between 0.1 and 0.05. Let’s assume that the p-value is the average of these values, 0.075.
However, our t-test is two-sided. Therefore, we will need to multiply the obtained p-value by two.
Finally, the estimated p-value for this example will equal 0.15.
Conclusion
While the example in this post is elementary, the idea behind finding the p-value will be the same. It is also essential for you to remember that you can use this technique to find the p-value for problems involving all sample sizes.
When calculating the p-value by hand, you won’t have to take the critical values approach. But to understand it better, you could plot out normal distributions and graph out the data to make sense of it.
We have various comprehensive calculators that you can use online for free. You can choose from t-test calculator, graphing, matrix, the standard deviation to statistics, and scientific calculators. Check it on our site.