Top Statistics Formulas
Here you will find the most common statistics equations and formulas used in high school and fundamental university courses. These include basic statistical measures and probability formulas. For more calculus based statistics formulas, please see here.
Basic Equations
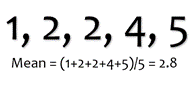
Average or Mean
Where xi are all the individual data points, and N is the number of points being averaged
| x̄ | = | ∑ |
|
= |
|
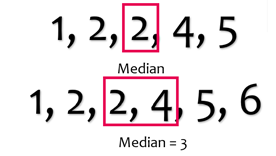
Median
The middle value in the set of numbers that are arranged in ascending order. If there are an even number of values, the median is the average of the two middle values.
| If n is odd | ( |
|
) | th term |
| If n is even | ( |
|
) | th term | + | ( |
|
+ 1 | ) | th term |
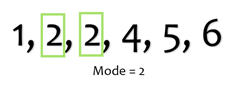
Mode
The most frequently occurring value in the set of values
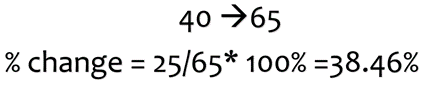
Percent Change
+ Means an increase
- Means a decrease
| % Change = |
|
×100% |
Statistical Measures
Standard Deviation
Standard Deviation is one measure of how spread the data is.
| Sample | S = | √ |
|
Where x̄ is the sample mean and n is the number of observations
| Population | σ = | √ |
|
Where μ̄ is the population mean and n is the number of observations
Variance
Variance is one measure of how spread the data is. It is the standard deviation squared.
| Sample | S 2 = |
|
Where x̄ is the sample mean and n is the number of observations
| Population | σ 2 = |
|
Where μ̄ is the population mean and n is the number of observations
Covariance
Covariance is a measure of two variables’ joint variability, or how they will vary together.
| Sample | Cov(x,y) = |
|
The measure of variance between variables x and y, where x̄ is the sample mean of the x values, ȳ is the mean of the y values, and n is the number of observations
| Population | Cov(x,y) = |
|
Chi Squared
Chi Squared tells you the difference between your observations and what you expected.
| X2 = | ∑ |
|
Where Oi is the observed value and Ei is the expected value
Probability
Probability of Event A
| P(A) = |
|
Where f is the frequency of the event and n is the sample size
Probability of Complement of Event A
In other words, the probability of A not occurring.
| P(Not A) = 1 - P(A) |
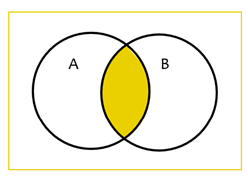
Multiplication Rule Independent Events
In other words, the probability of A and B occurring independently.
| P(A and B) = P(A) * P(B) |
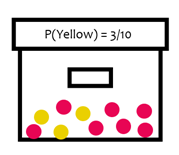
General Multiplication Rules
To be used when one event A affects the probability of event B.
| P(A and B) = P(A) * P(B given A) |
| P(A and B) = P(B) * P(A given B) |
For example,
Drawing marbles out of the box without replacement will affect the probability of drawing a marble of a certain color.
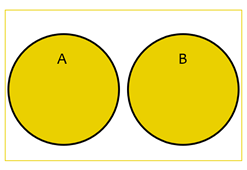
Addition Rule Mutually Exclusive Events
In other words, the probability of either A or B occurring.
| P(A or B) = P(A) + P(B) |
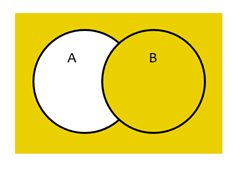
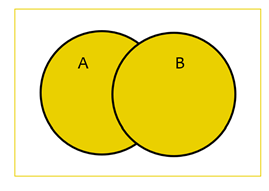
General Addition Rule
In other words, the probability of either A or B occurring.
| P(A or B) = P(A) + P(B) - P(A and B) |
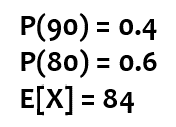
Expected Value
Expected Value is the final predicted value of a variable, computed by multiplying each possible value by its probability and summing it.
| E[x] = | ∑ | xiP | ( | xi | ) |
Where xi are the values of x and P(xi) are the probabilities of each value